Data & Analytics for Better Decisions
Turn data into insight with Power BI and Microsoft Fabric. Build dashboards, unify data, and create an AI‑ready analytics foundation.

What is Data & Analytics?
Data & Analytics is about creating a trusted foundation for decision‑making. It combines clean data, clear reporting, and the ability to explore insights quickly.
Many organisations have data but struggle to use it. Reports are slow, inconsistent, and dependent on spreadsheets. We help you change that with a modern Microsoft analytics stack.
Power BI delivers the dashboards and self‑service reporting teams need day‑to‑day. Microsoft Fabric provides the unified data platform for engineering, warehousing, and AI‑ready datasets.
We take an outcomes‑first approach: deliver a high‑impact dashboard quickly, then expand to broader analytics and data platform capabilities over time.
Problems Data & Analytics Solves
If reporting feels slow or inconsistent, a modern analytics approach can help.
Data Spread Across Systems
Your data sits in spreadsheets, CRM, finance, and operational tools with no single view.
Slow, Manual Reporting
Reports take days to produce and are often outdated by the time they land.
Inconsistent Numbers
Different teams use different spreadsheets, creating conflicting results.
Limited Self‑Service
Business users rely on IT for every report change or new request.
No Real‑Time Visibility
Leaders lack live visibility into KPIs and operational performance.
AI Readiness Gaps
Poor data foundations slow adoption of Copilot and AI capabilities.
Power BI + Microsoft Fabric
Two platforms that work together to deliver analytics from desktop to enterprise scale.
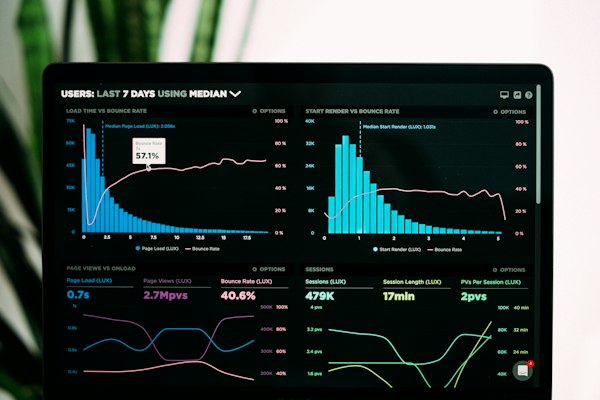
Power BI
Interactive dashboards and self‑service analytics for every team.
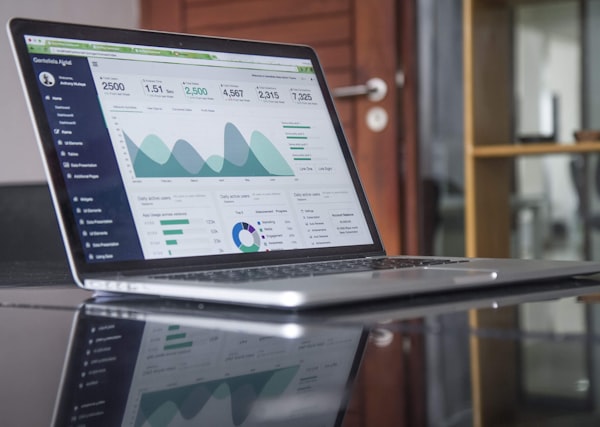
Microsoft Fabric
A unified data platform for engineering, warehousing, and AI at scale.
Where Analytics Delivers Impact
Use analytics to improve performance across every team and department.
Executive Scorecards
Track performance across finance, sales, and operations in one view.
Sales & Pipeline
Monitor pipeline health, win rates, and forecasting accuracy.
Operational Monitoring
Track production, service delivery, and utilisation in real time.
Customer Analytics
Unify customer data to understand churn, CLV, and engagement.
Financial Reporting
Automate P&L, cash flow, and budget vs actual reporting.
Supply Chain Insights
Track inventory, supplier performance, and logistics costs.
Built for Scalable Analytics
A secure foundation, rapid delivery, and enterprise‑grade governance.
Unified Data Foundation
Create a trusted data layer that powers reporting, analytics, and AI.
- Single source of truth
- Consistent metrics
- Governed access
- Audit trails

Self‑Service Analytics
Enable teams to explore insights without heavy reliance on IT.
- Certified datasets
- Role‑based access
- Training & enablement
- Reduced backlog

Real‑Time Dashboards
Monitor KPIs as they change with live data and alerts.
- Streaming data
- Threshold alerts
- Operational visibility
- Faster response

AI‑Ready Platform
Prepare data for Copilot and ML‑driven insights.
- Clean datasets
- Model readiness
- AI integration
- Future‑proofing

Why UK Growing Businesses Choose Our Analytics Stack
Power BI and Fabric provide enterprise‑grade analytics without the enterprise overhead.
Start Small
Deliver your first dashboard in weeks and expand with confidence.
Leverage Microsoft Stack
Connect to Microsoft 365, Dynamics 365, and existing databases easily.
Reduce Manual Reporting
Replace spreadsheets with automated, governed reporting.

Scale Over Time
Add data sources and advanced analytics as you grow.
Cost‑Effective
Start with Power BI and scale into Fabric when needed.
Security Built‑In
Enterprise‑grade security without enterprise overhead.
The Business Impact of Data & Analytics
Organisations adopting modern analytics see faster decisions and better performance.
How We Deliver Analytics
We follow the Kompound Effect to deliver early wins and build a long‑term analytics foundation.
Discovery & KPI Design
Define the metrics that drive performance and focus on the highest‑impact insights.
Data Integration
Connect systems, clean data, and build governed datasets.
Dashboard Delivery
Launch dashboards quickly and iterate based on user feedback.
Enablement & Scale
Train teams and expand analytics capability over time.

Frequently Asked Questions
Common questions about data and analytics for UK businesses.
What’s the difference between Power BI and Microsoft Fabric?
Power BI is the analytics and visualisation layer. Fabric is the broader unified data platform that includes data engineering, warehousing, and AI capabilities. Many organisations start with Power BI and adopt Fabric as their data estate grows.
Can you work with our existing data sources?
Yes. We connect to Microsoft 365, Dynamics 365, SQL, Excel, and hundreds of third‑party systems using built‑in connectors or APIs.
How quickly can we see results?
Most organisations see their first dashboards within 2–4 weeks, with additional insights delivered iteratively.
Do we need a data warehouse first?
Not always. We can start with existing data sources and introduce warehousing or Fabric as needed.
Is this secure and compliant?
Yes. We implement role‑based access, auditing, and governance aligned to Microsoft best practices.
Related Solutions & Resources
Explore complementary services that work alongside analytics.
Power BI
Explore interactive dashboards and self‑service analytics in Power BI.
Learn more SolutionMicrosoft Fabric
Build a unified data platform for engineering, warehousing, and AI.
Learn more ResourceCase Studies
See how UK organisations improved decisions with data analytics.
Learn more
Ready to build a modern analytics foundation?
Let’s identify the insights that will drive better decisions across your organisation.
Our initial consultation is complimentary. We'll discuss your objectives and provide honest guidance on next steps.